Advances in software platforms and AI have allowed data collection to grow exponentially. In sports such as lacrosse, hockey and soccer, collecting data for shots have been very impactful in driving how coaches create their game plans and study performances. Similarly, knowing if goalies need to improve their performance against certain shot types or from specific locations can be accomplished through automated shot reports.
For offense, coaches should be looking to answer the following questions:
Which players are scoring or getting shots on goal at high rates from each side? Do our plays optimize their shots from those locations?
What plays are generating high quality chances?
How do we define high quality chances? By distance from goal or by a probability driven metric like expected goals?
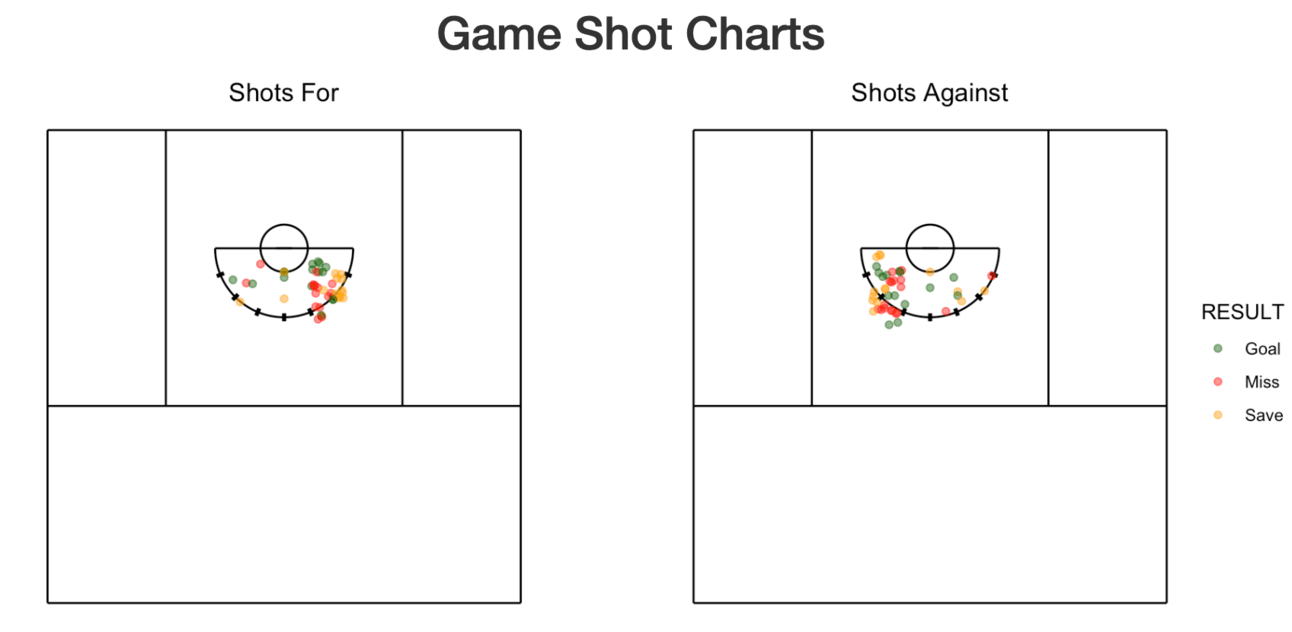
If postgame reports are generated with detailed shot events, coaches can quickly answer these questions without having to spend extra time studying film two or three times over. In the charts below, each shot is mapped onto a women’s lacrosse field and color coded by the result. There are trends that can be quickly extracted, such as a quantity of shots from a particular side. Broken down farther, though, coaches can filter or color code these shots by play, quarter, and more.

The shots in the chart above are demo data and do not reflect real events

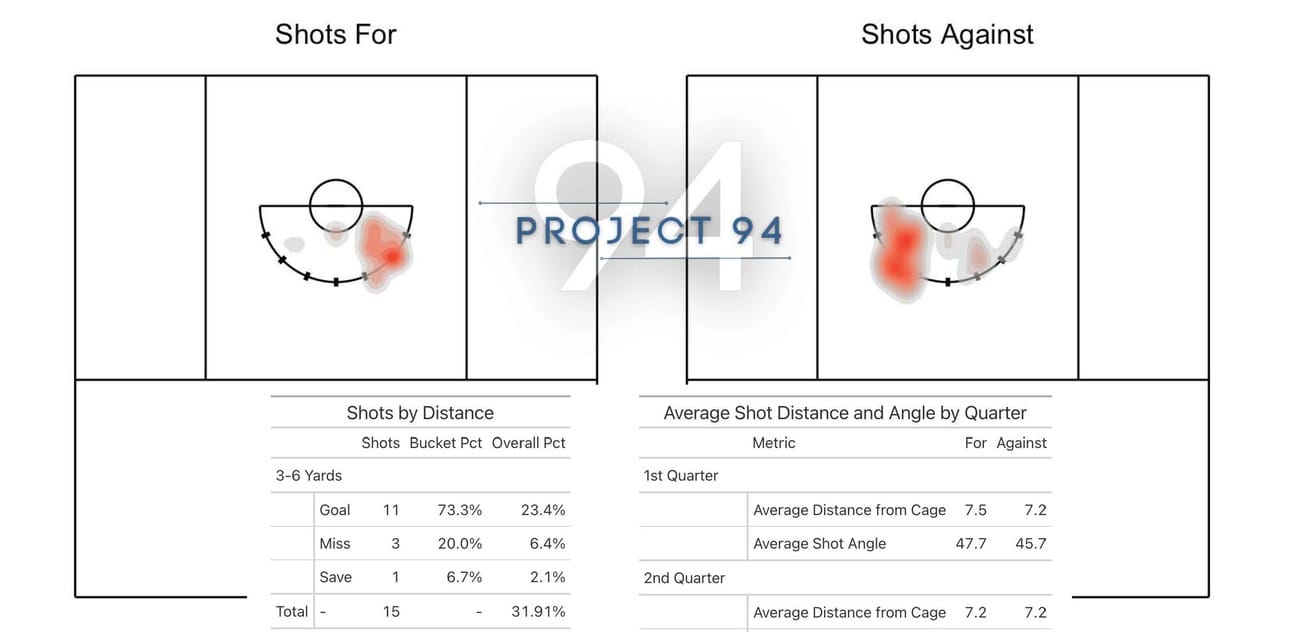
The shots in the chart above are demo data and do not reflect real events
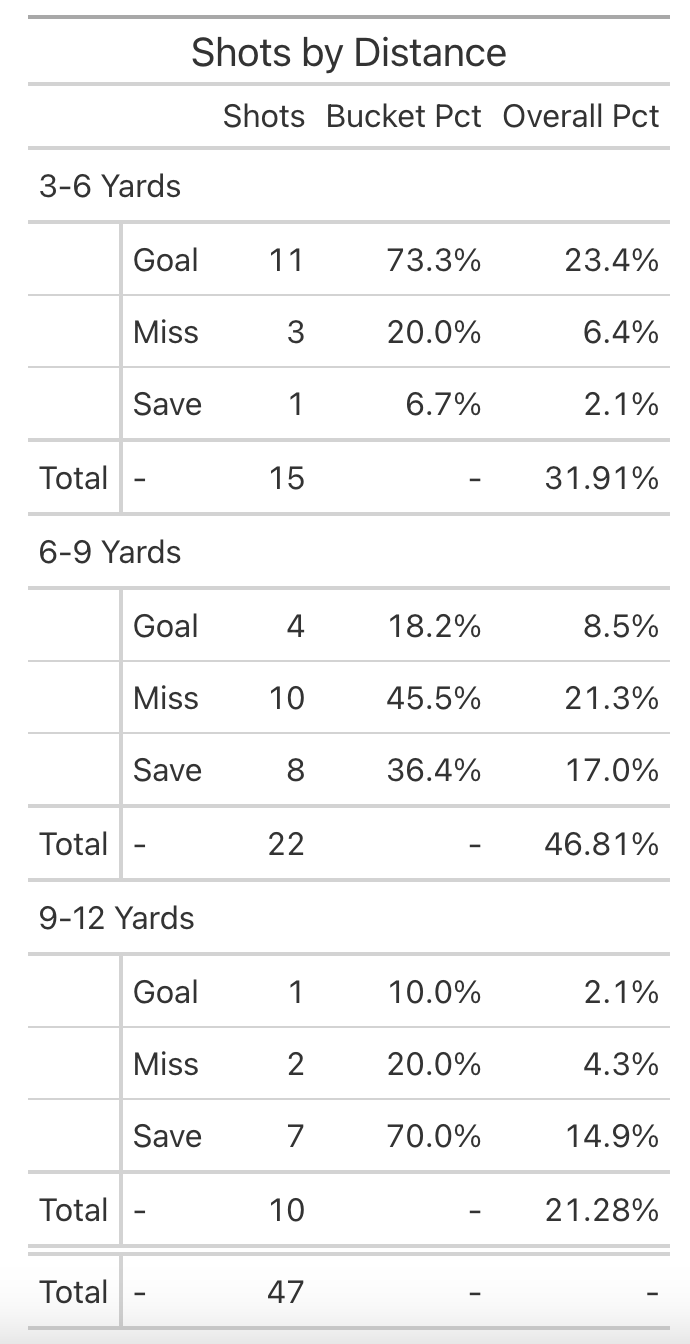
If players are struggling from certain distances, or simply not hitting the coach’s goals on getting shots from distance “buckets”, staffs can adjust practice plans following games and quickly fix low offensive efficiency. Coaches can also identify players who have high shooting percentages in certain game situations to optimize lineup, such as man advantage or 4th quarter. The same problem identification works on the defensive side of the game, where coaches can identify where shots and goals are being allowed the most, and under what circumstances.
Programs can easily integrate shots into their play-by-play reporting or data platform. Mapping other game data collection systems, like wearables, to shot tracking can tell a more complete story into why events occur and how to either increase or decrease the probability of an event happening. For example, if film highlights and breakdowns are collected through Hudl or ScoreBreak, shot tracking can be connected to those highlights and provide detailed information about context, time of play, etc. for postgame and season reports. The raw data from those softwares can be turned into powerful insights. Central databases can be used to then store play-by-play and build trends analysis for shot quality. Were the shots that you scored in the first 2 games the same as the ones you’ve scored since then? In the most recent 2 games?
If you are interested in learning more about shot tracking for lacrosse or how another shot tracking system can easily integrate into your coaching process, feel free to reach out! Project 94 provides detailed shot data (using film collected through your provider or through film done by Project 94), automated postgame and season reporting and customized analytics.

